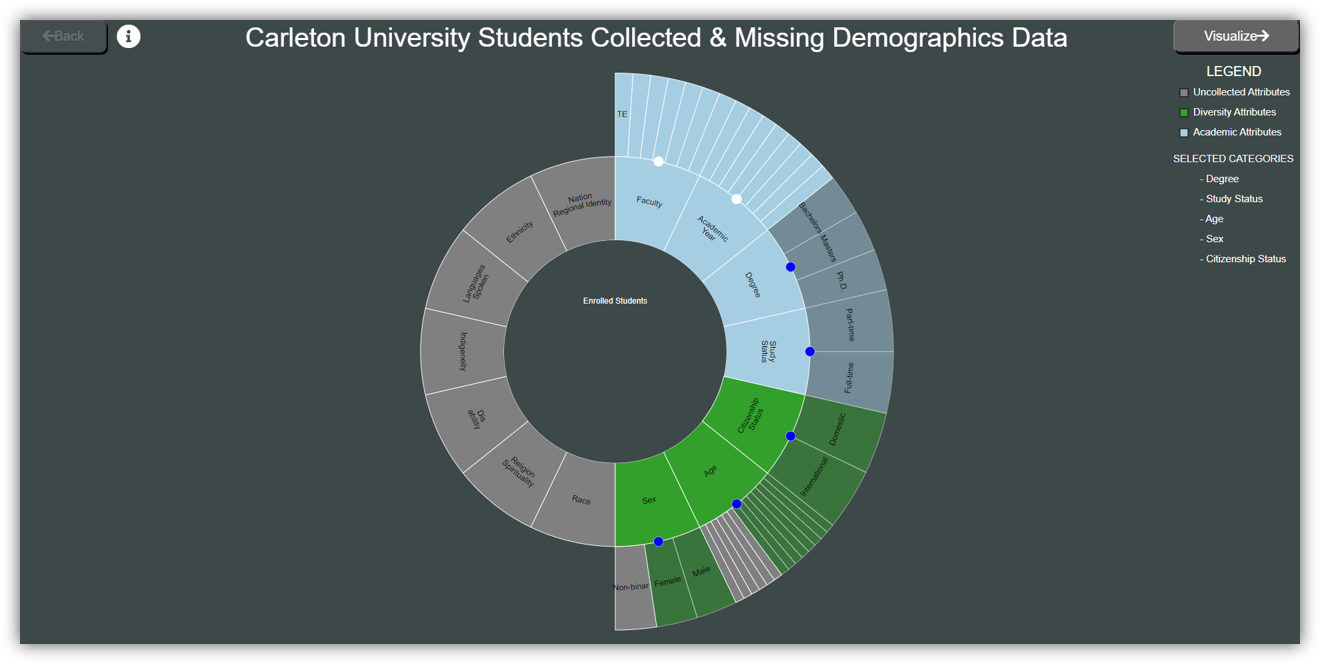
Presenting a visualization of demographics of students at Carleton University. The primary goal was to design an interactive visualization on a web-based platform. It allows graphical comparison of student diversity in various academic categories. The secondary goal was to show the lack of demographic diversity data collected by the University. The visualization could reveal patterns, trends or anomalies. Universities may consider them as they work to effect policy changes in relation to diversity, equity and inclusion. The visualization may motivate other researchers and designers to develop similar innovative visualizations.